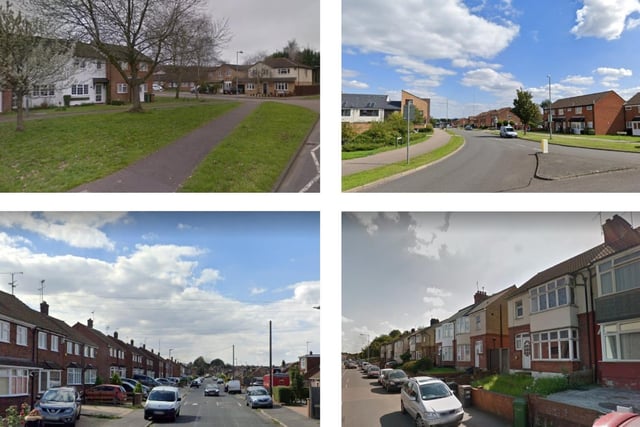
Covid case rates in Luton have risen by 46.4% in the latest weekly figures, but one of the town's 21 neighbourhoods actually saw a drop in infections. The data for the town as a whole shows a case rate of 1,094.9 per 100,000 people in the week to December 23, up from the previous week's 747.9 figure.
The latest data for Luton shows 20 out of 21 neighbourhoods saw an increase in infections in the latest seven-day period. Here we reveal which neighbourhoods saw the biggest rise in case rates per 100,000 people in the week to December 23, and the one area which bucked the trend.
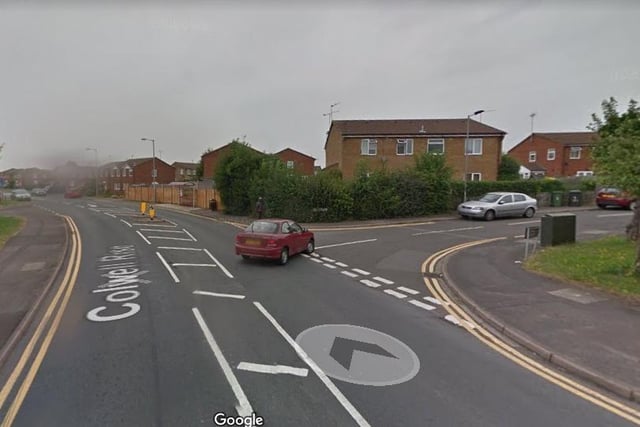
2.
Wigmore has seen rates of positive Covid cases rise by 136% from 787.7 per 100,000 people on week ending December to 1859.0 on week ending December 23. PHOTO: Google
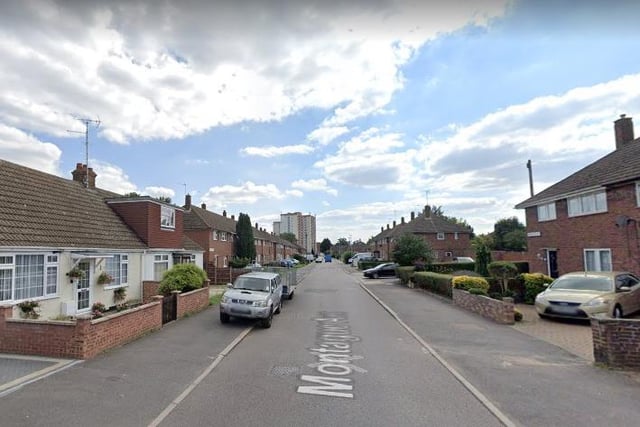
3.
Leagrave has seen rates of positive Covid cases rise by 106.4% from 616 per 100,000 people on week ending December 16 to 1271.7 by week ending December 23. PHOTO: Google
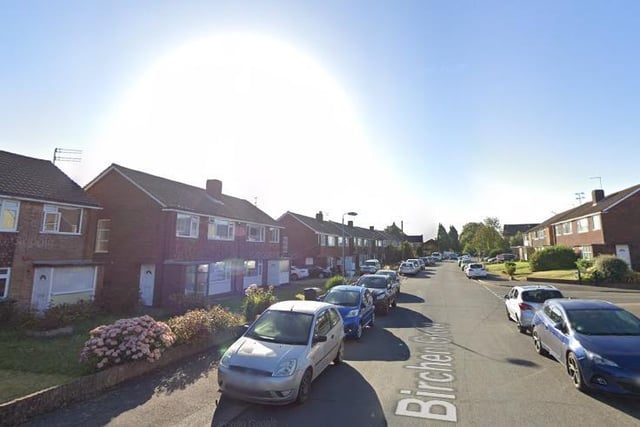
4.
Stopsley South & Round Green has seen rates of positive Covid cases rise by 92.8% from 663.7 per 100,000 people on week ending December 16 to 1279.3 by week ending December 23. PHOTO: Google